การหากลุ่มหลักทรัพย์ที่เส้นประสิทธิภาพ Efficient Frontier ด้วย Python
การทำ portfolio optimization ด้วย google colab IX
warren buffett กล่าวว่าเราไม่ควรนำไข่ใส่ไว้ในตะกร้าเดียวกัน เป็นคำพูดที่แสดงให้เห็นถึงความสำคัญของการกระจยความเสี่ยงได้ดี แต่ผมขอถามเพื่อน ๆ เพื่อน ๆ คิดว่าการกระจายความเสี่ยงที่ดีเป็นอย่างไร ใช่การกระจายเงินลงทุนในสินทรัพย์ที่หลากหลายให้มากที่สุดหรือไม่
คำตอบคือไม่จริงเสมอไป พอร์ตการลงทุนที่ดีคือพอร์ตการลงทุนที่เหมาะสมที่สุดสำหรับข้อจำกัดและความต้องการของผู้ลงทุน เป็นที่มาของชื่อซีรีย์ portfolio optimization ของเรานั้นเอง
เปิด colab กันเลย
เริ่มเหมือนเคยคือ load packeges
# load packagesimport pandas as pdimport numpy as np
import pandas_datareader as pdr
import seaborn as sns
from matplotlib import pyplot as plt
import pandas_datareader as web
import datetime# not needed, only to prettify the plots.
import matplotlib
from IPython.display import set_matplotlib_formats
ดึงข้อมูลเราใช้ผลตอบแทนรายเดือนแยกตามอุตสาหกรรมของสหรัฐดึงได้จากลิงค์นี้เลยนะครับ https://raw.githubusercontent.com/nutdnuy/Portfolio_optimization_with_Python/master/data/ind30_m_vw_rets.csv
ind = pd.read_csv("https://raw.githubusercontent.com/nutdnuy/Portfolio_optimization_with_Python/master/data/ind30_m_vw_rets.csv", header=0, index_col=0)/100ind.index = pd.to_datetime(ind.index, format="%Y%m").to_period('M')
เราจะใช้ Scipy ในการจำลองผลตอบแทนและความเสี่ยงซึ่งจำเป็นต้องใช้ผลตอบแทนและความแปรปรวนร่วมเราจึงต้องสร้างฟังชันผลตอบแทนขึ้นมาก่อน
def annualize_rets(r, periods_per_year):compounded_growth = (1+r).prod()n_periods = r.shape[0]return compounded_growth**(periods_per_year/n_periods)-1
ประกาศตัวแปลผลตอบแทนและความแปรปรวมร่วม
er = annualize_rets(ind["1996":"2000"], 12)cov = ind["1996":"2000"].cov()
2-Asset Class
เริ่มจาก2-Asset Class ก่อน
n_points = 20weights = [np.array([w, 1-w]) for w in np.linspace(0, 1, n_points)]
n_points คือจุดที่เราจะให้มีบนเส้น หลังจากนั้นเราต้องสร้างฟังชั่นแปลผลตอบแทนของพอร์ตซึ่งผลตอบแทนที่คาดหวังของพอร์ตการลงทุนเท่ากับค่าเฉลี่ยถั่วนั้าหนักของผลตอบแทนหลักทรัพย์แต่ละชนิด
def portfolio_return(weights, returns):return weights.T @ returns
อีกฟังก์ชั่นของความผันผวนของพอร์ตให้แยกประกาศฟัชชั่นเพื่อคนอ่านจะได้เข้าใจง่าย

def portfolio_vol(weights, covmat):return (weights.T @ covmat @ weights)**0.5vols = [portfolio_vol(w, cov.loc[l,l]) for w in weights]ef = pd.DataFrame({"R": rets, "V": vols})
เรียกใช้ Scipy เพื่อหาค่า minimize
from scipy.optimize import minimizedef minimize_vol(target_return, er, cov):n = er.shape[0]init_guess = np.repeat(1/n, n)bounds = ((0.0, 1.0),) * n # an N-tuple of 2-tuples!# construct the constraintsweights_sum_to_1 = {'type': 'eq','fun': lambda weights: np.sum(weights) - 1}return_is_target = {'type': 'eq','args': (er,),'fun': lambda weights, er: target_return -portfolio_return(weights,er)}weights = minimize(portfolio_vol, init_guess,args=(cov,), method='SLSQP',options={'disp': False},constraints=(weights_sum_to_1,return_is_target),bounds=bounds)return weights.x
เราจะได้กราฟออกมา
ef.plot.scatter(x="V", y="R");
ต่อมาเราอยากให้ลากเส้นผ่านแต่ละจุดสร้างฟังชันดังนี้
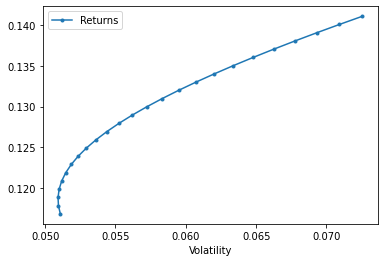
def plot_ef2(n_points, er, cov):if er.shape[0] != 2 or er.shape[0] != 2:raise ValueError("plot_ef2 can only plot 2-asset frontiers")weights = [np.array([w, 1-w]) for w in np.linspace(0, 1, n_points)]rets = [portfolio_return(w, er) for w in weights]vols = [portfolio_vol(w, cov) for w in weights]ef = pd.DataFrame({"Returns": rets,"Volatility": vols})return ef.plot.line(x="Volatility", y="Returns", style=".-")
plot ก็จะได้กราฟที่เราอยากได้
plot_ef2(25, er[l].values, cov.loc[l,l])
Note book;
https://colab.research.google.com/drive/1kvhKYKZkf-WoYdY7hOypyLqrqcE7k2LZ?usp=sharing
https://colab.research.google.com/drive/1moEcfQzXoiiVKwahfpME8otiQY1EcvXa?usp=sharing
อ้างอิง;
อ่านตอนอื่นๆได้ที่
- การคำนวณผลตอบแทนการลงทุนด้วย Python
- การหาความผันผวนของพอร์ตการลงทุนด้วย Python
- การหา Max Drawdown ด้วย Python
- การวัด การเบี่ยงเบนของผลตอบแทนด้วย Python
- การวัด SemiDeviation ด้วย Python
- การวัด VaR. และ CVaR. ด้วย Python
- รีวิวการใช้ ffn. ใน Python
- การหา Top Drawdown ด้วย Python
- การหาค่า Sharpe ratio ด้วย Python
- การหากลุ่มหลักรัพย์ที่เส้นประสิทธิภาพ Efficient Frontier ด้วย Python
- การหา shape ratio สูงสุดและเส้น CML ด้วย Python
- การสร้างมูลค่าตลาดแบบถ่วงน้ำหนักด้วย PYTHON
- ข้อจำกัดของการกระจายความเสี่ยงและการทำประกันพอร์ตการลงทุน
- การจำลอง ผลตอบแทนด้วย RANDOM WALK Generation และ Montecarlo simulation
- Sharpe Style Analysis
- Factor Investing ด้วย Python
- วิเคราะห์ ประเภทกองทุนรวมด้วย Python
- การทำ Portfolio optimization
- สร้างแนวรับแนวต้านวิเคราะห์หุ้นด้วย Python
